
Build the product, not pictures of it
How rebuilding a broken, C-suite-facing finance tool as a live coded prototype cut engineering handover 80% - and shipped an operating model now standard across eight Bank Functions domains.
Details
- Company
- Emirates NBD · Finance / Data Analytics
- Programme
- Finance Insight Redesign
- Period
- Q2 2026
- Role
- Lead designer, concept to deployed prototype
At a glance
A single coded artifact that carried the product from stakeholder sign-off to engineering handover, a delivery cycle cut from ten days to two, and a workflow that outgrew the project.
-
−80%
Handover time
Design-to-development handover cut from 10 days to 2 - engineering received a working codebase with embedded documentation, not static specs.
-
40+
Weekly users
600+
Monthly queries
Finance staff, up to CFO level, using the redesigned tool weekly.
-
1 artifact
Business sign-off → Developer handover
One deployed prototype served stakeholder review, design-system documentation, and engineering handover - zero detail lost between them.
The brief
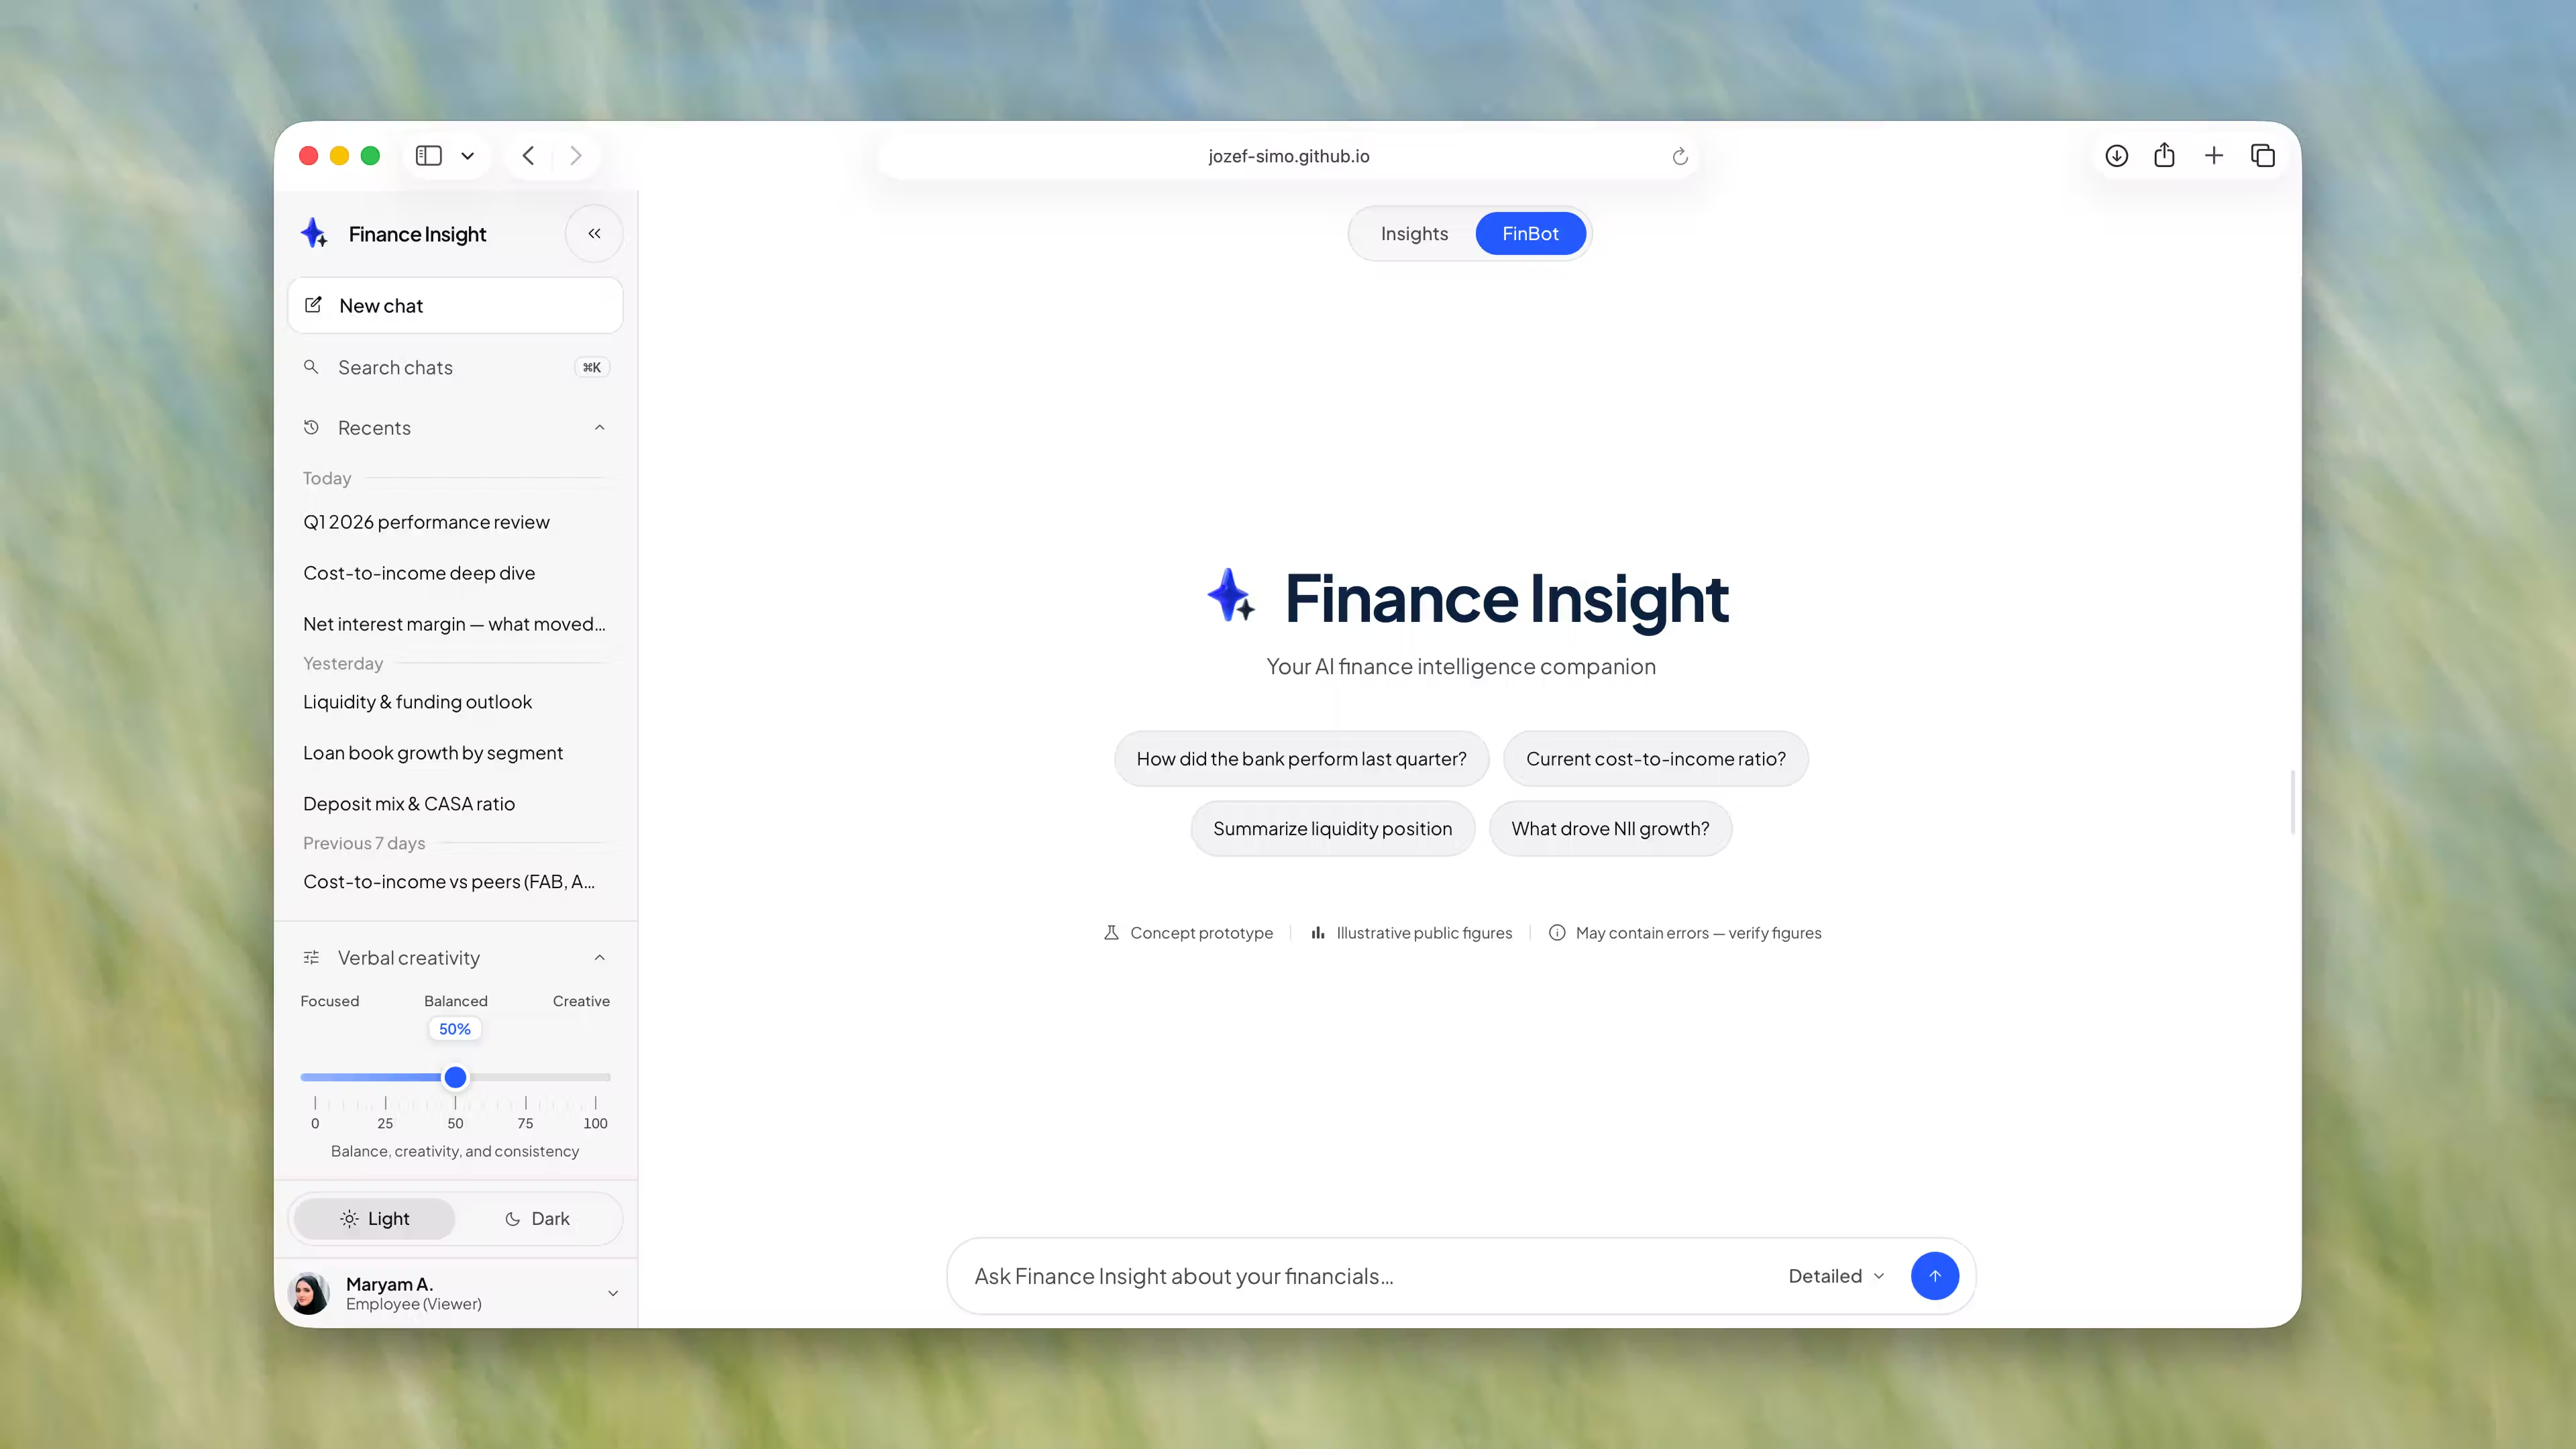
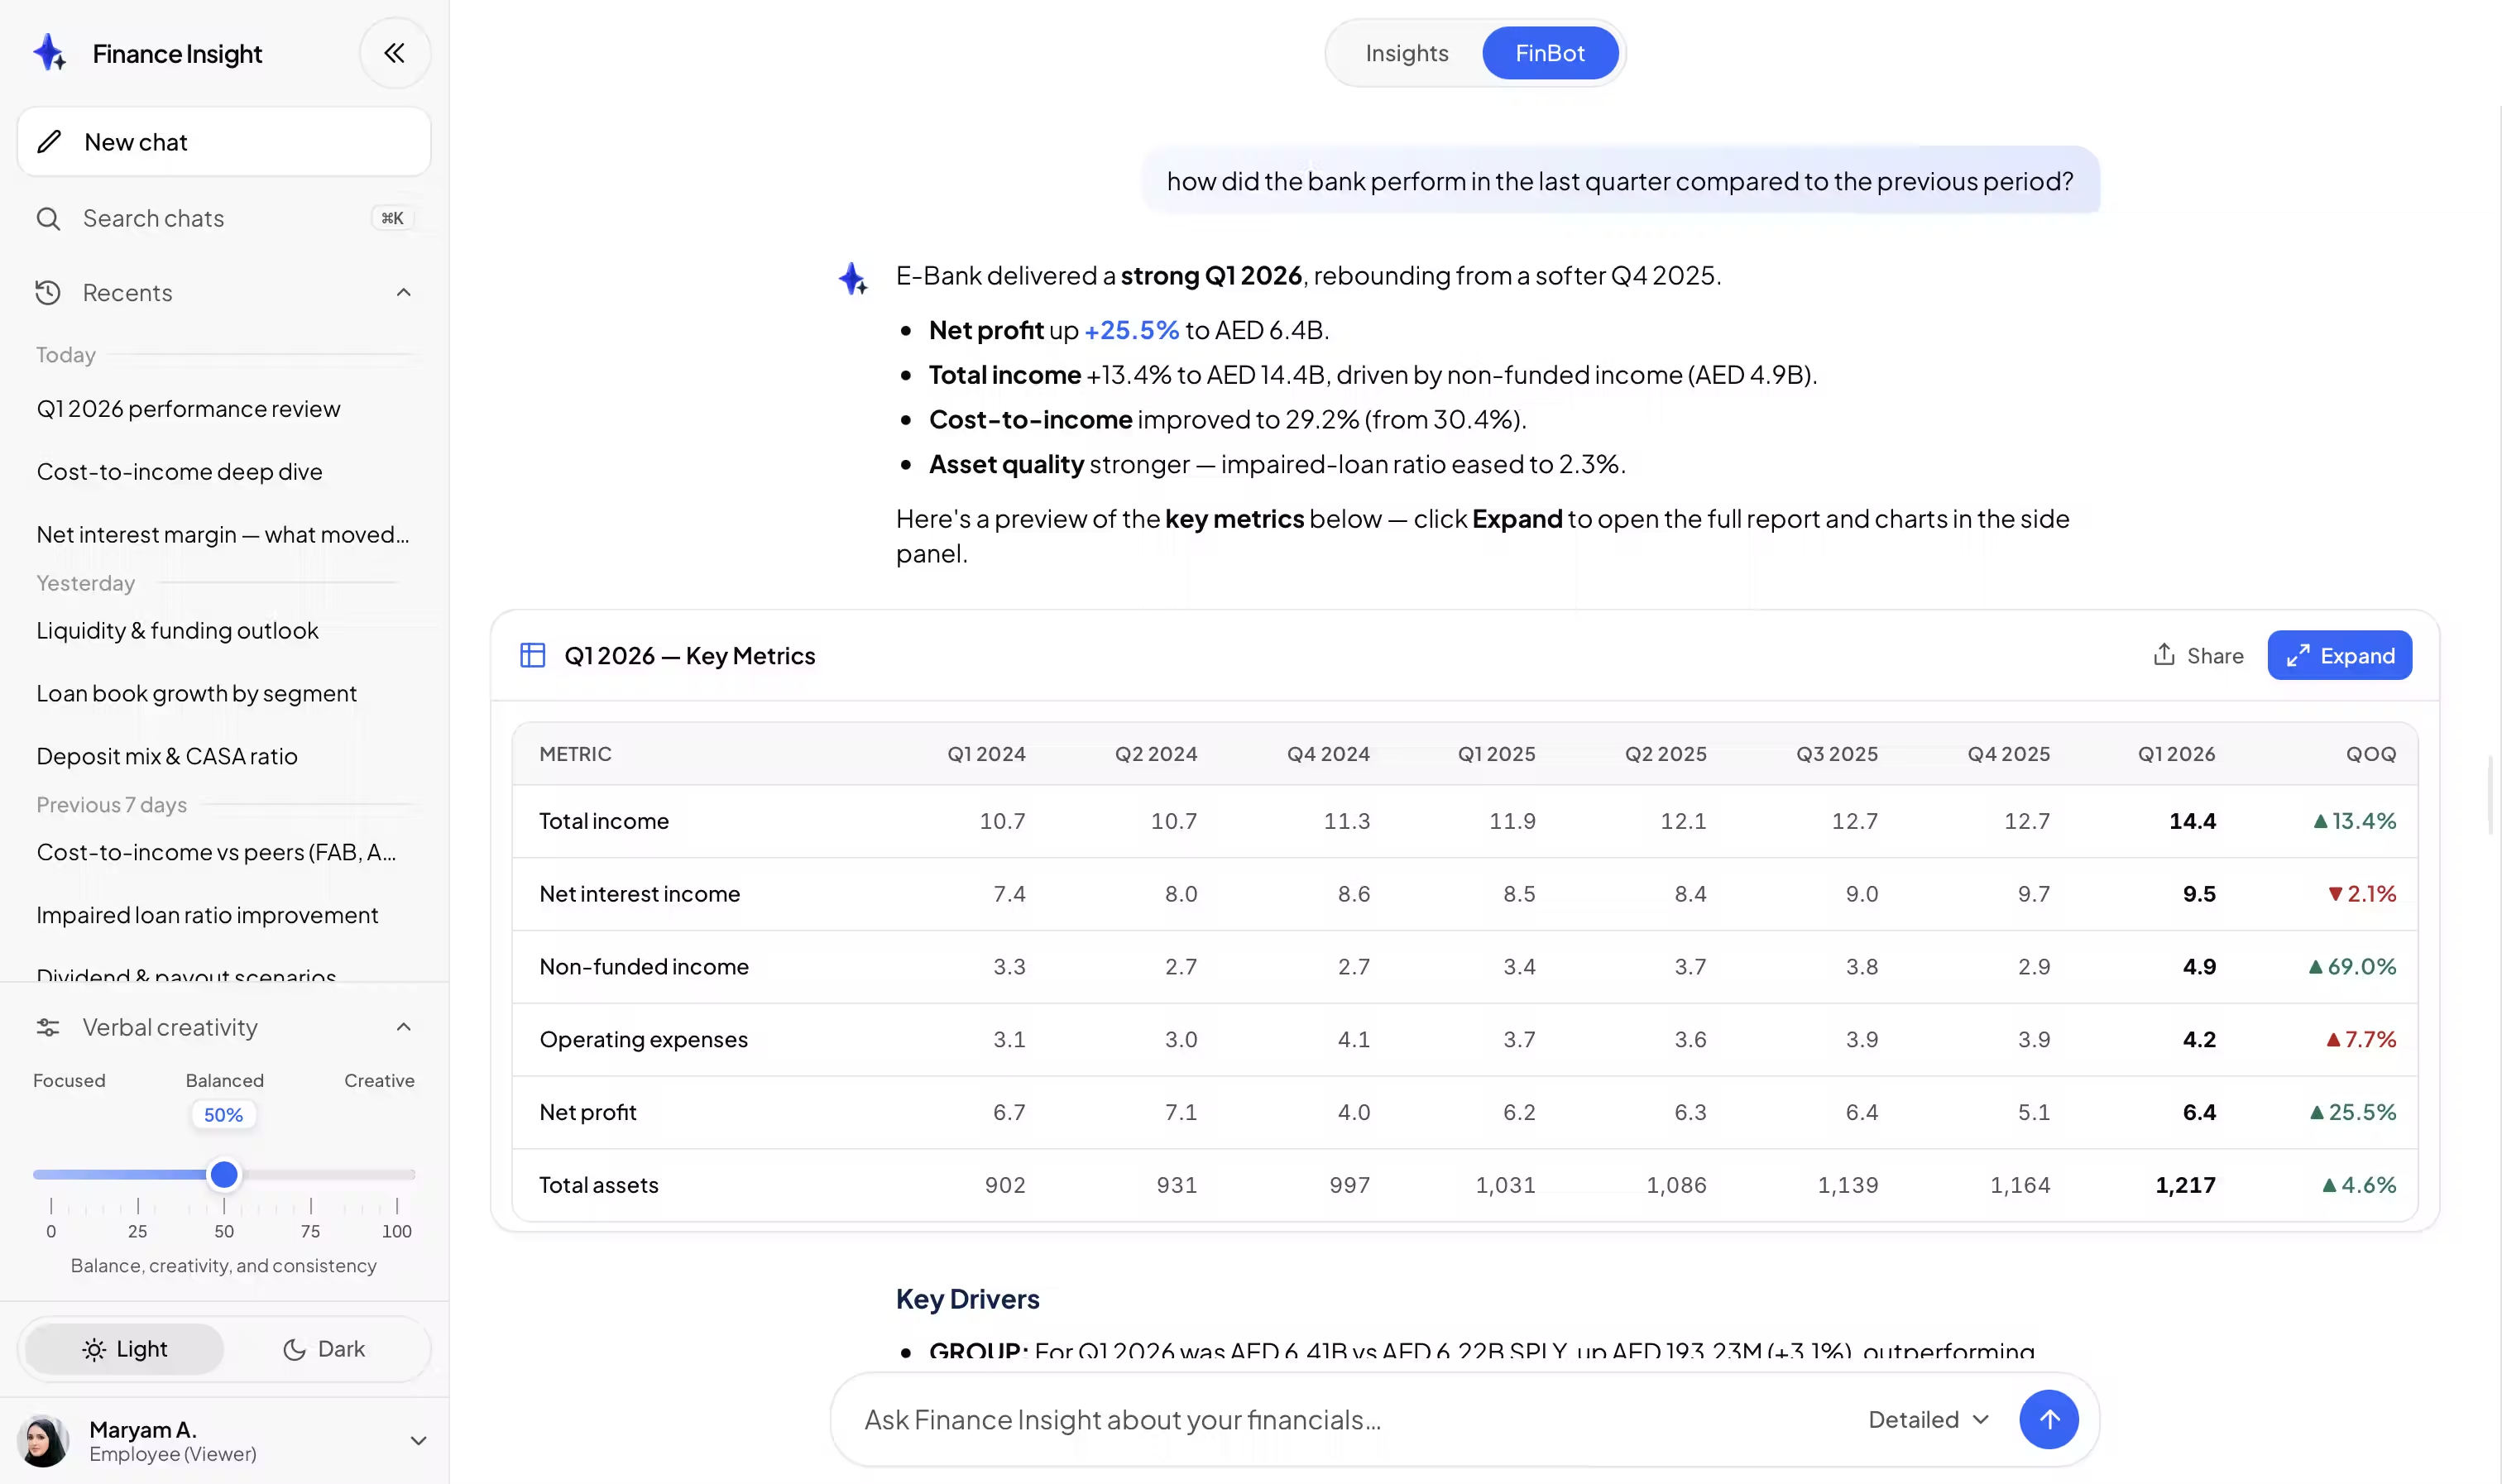
Finance Insight - the AI-powered chatbot the Finance department uses to query financial data in natural language - had grown functionally without design ownership. Tables and data visualizations broke on tablet and mobile. The interface sat visibly outside Emirates NBD brand guidelines. For a tool whose end users included the Chief Financial Officer, it fell short of the quality bar the bank applies to everything customer-facing.
 Aarthi Rajaram Iyer, Head of Finance & Risk Systems, set the challenge plainly: bring Finance Insight up to the standard of the bank’s flagship products. Enhance the visual experience, make it responsive across desktop, tablet, and mobile, and bring it fully within brand.
The unstated second brief was mine. The team’s static-mockup workflow couldn’t even show the problem: how data-dense components behave across screen sizes is invisible in flat Figma frames. The same workflow couldn’t fix it without leaking detail at handover.
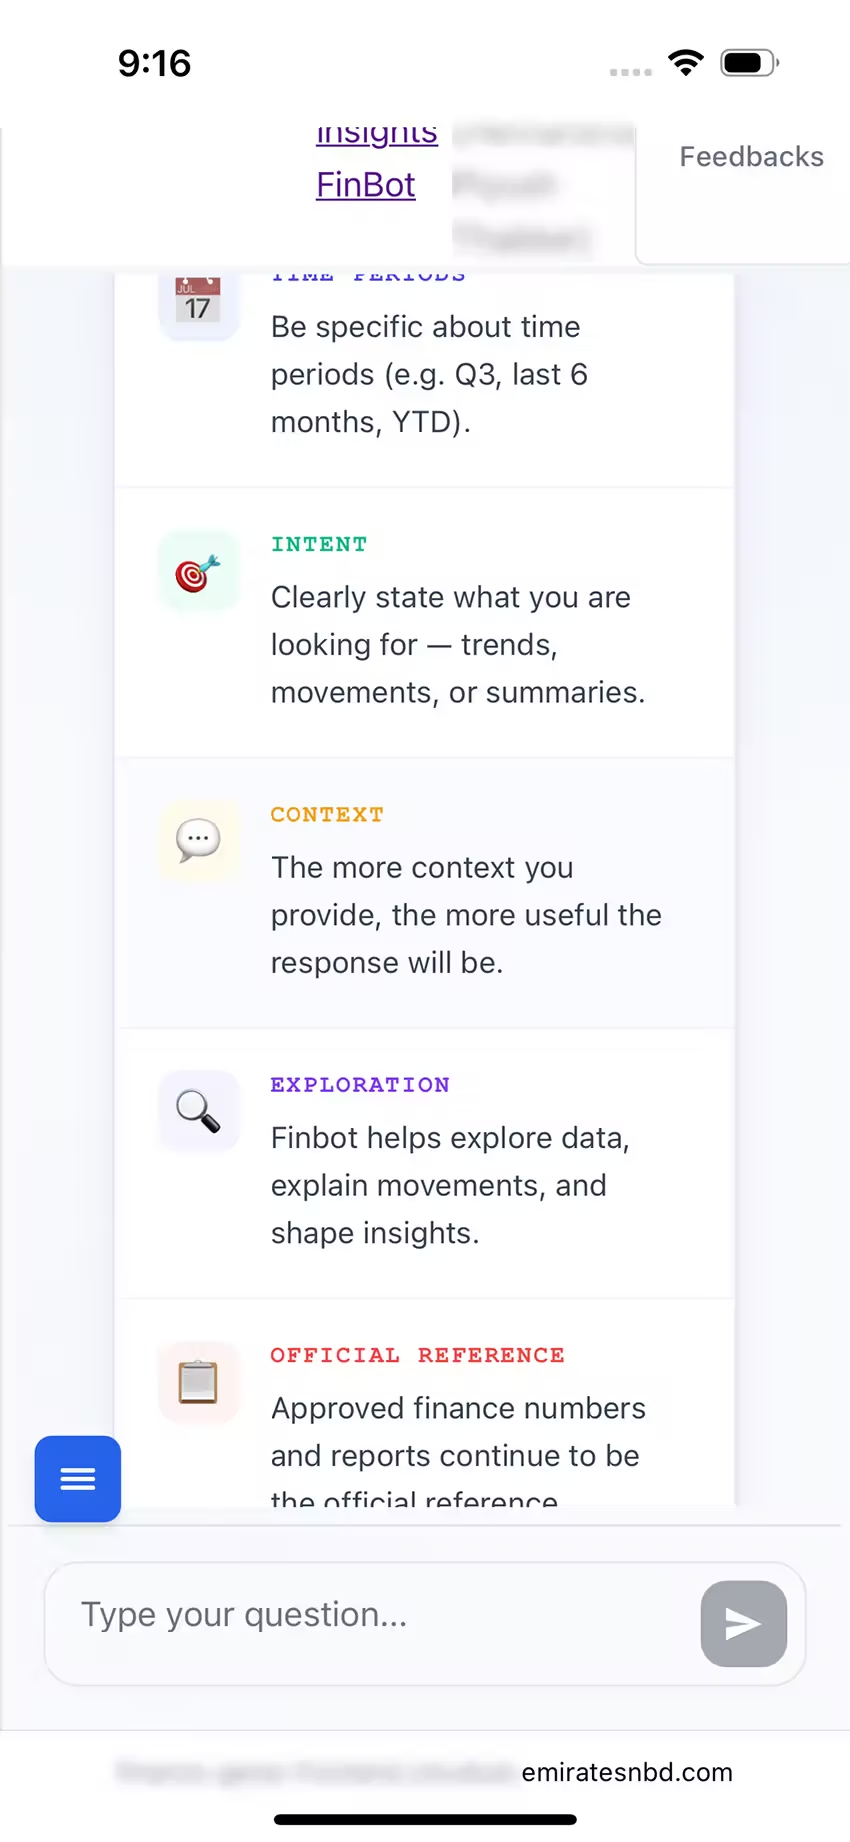
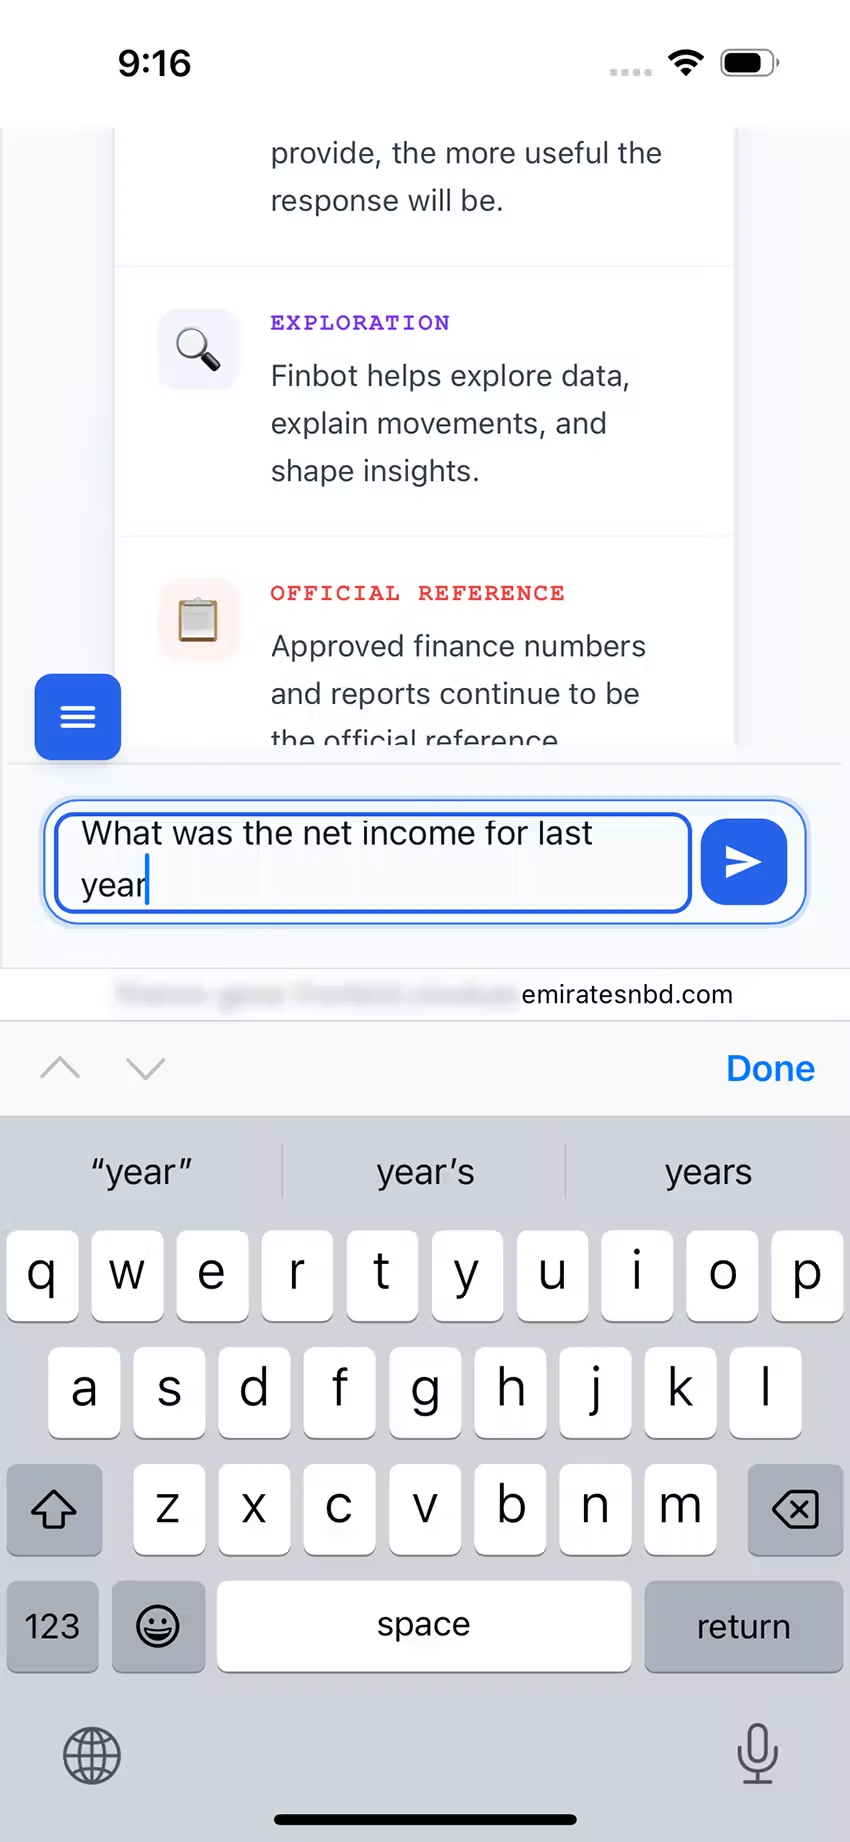
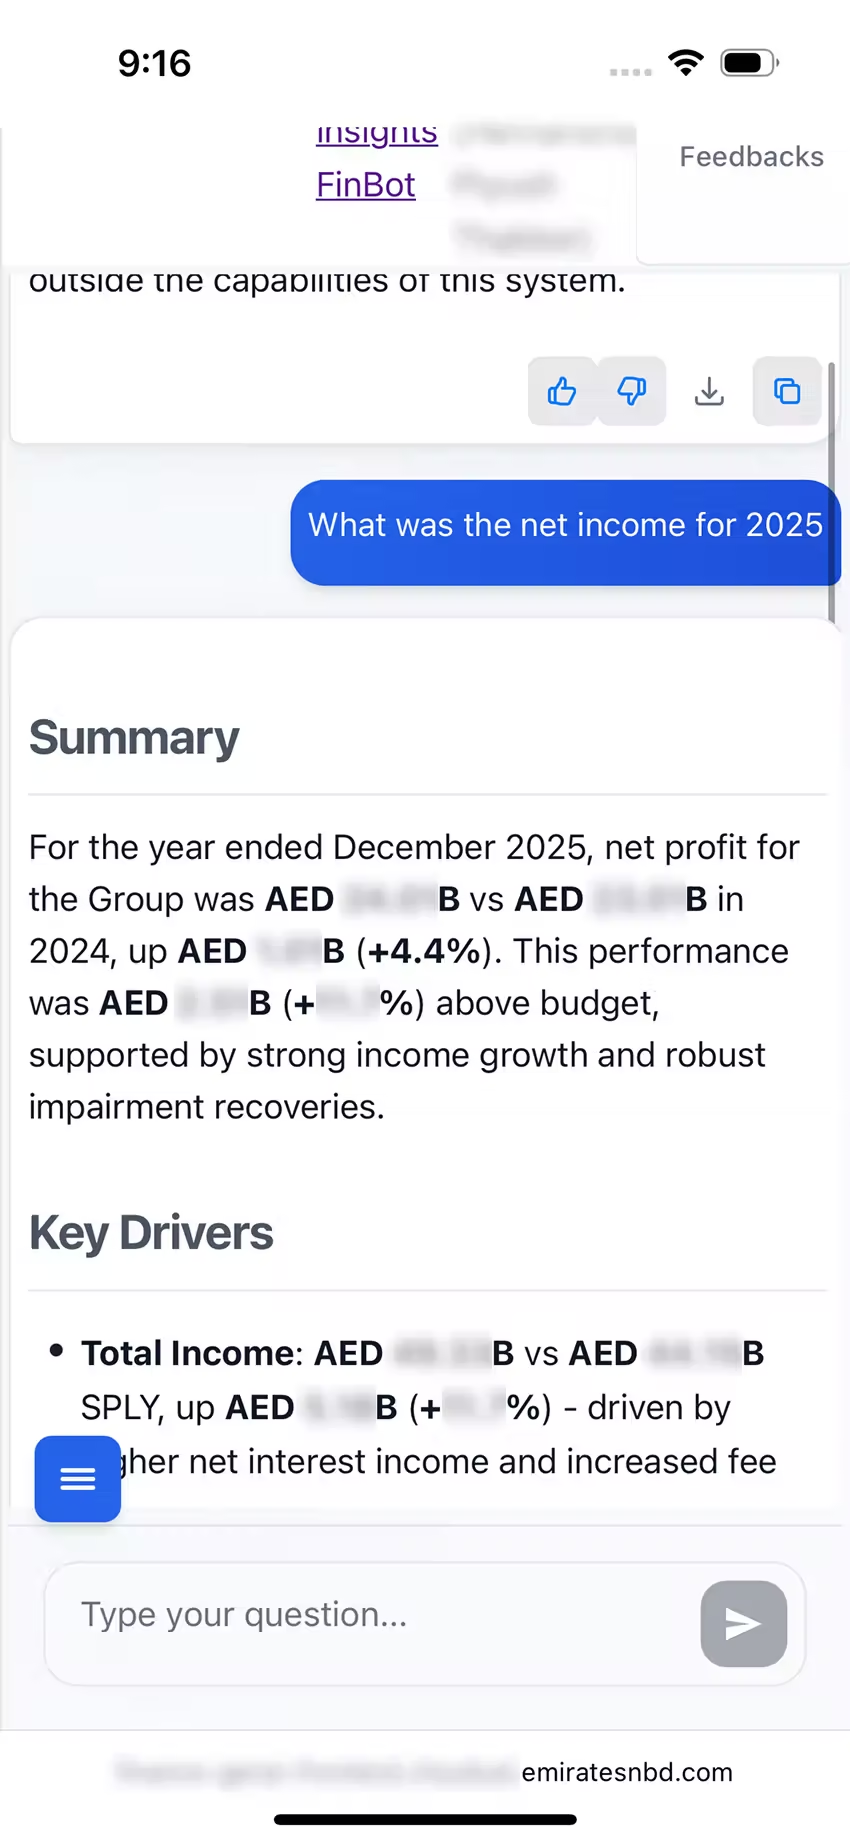
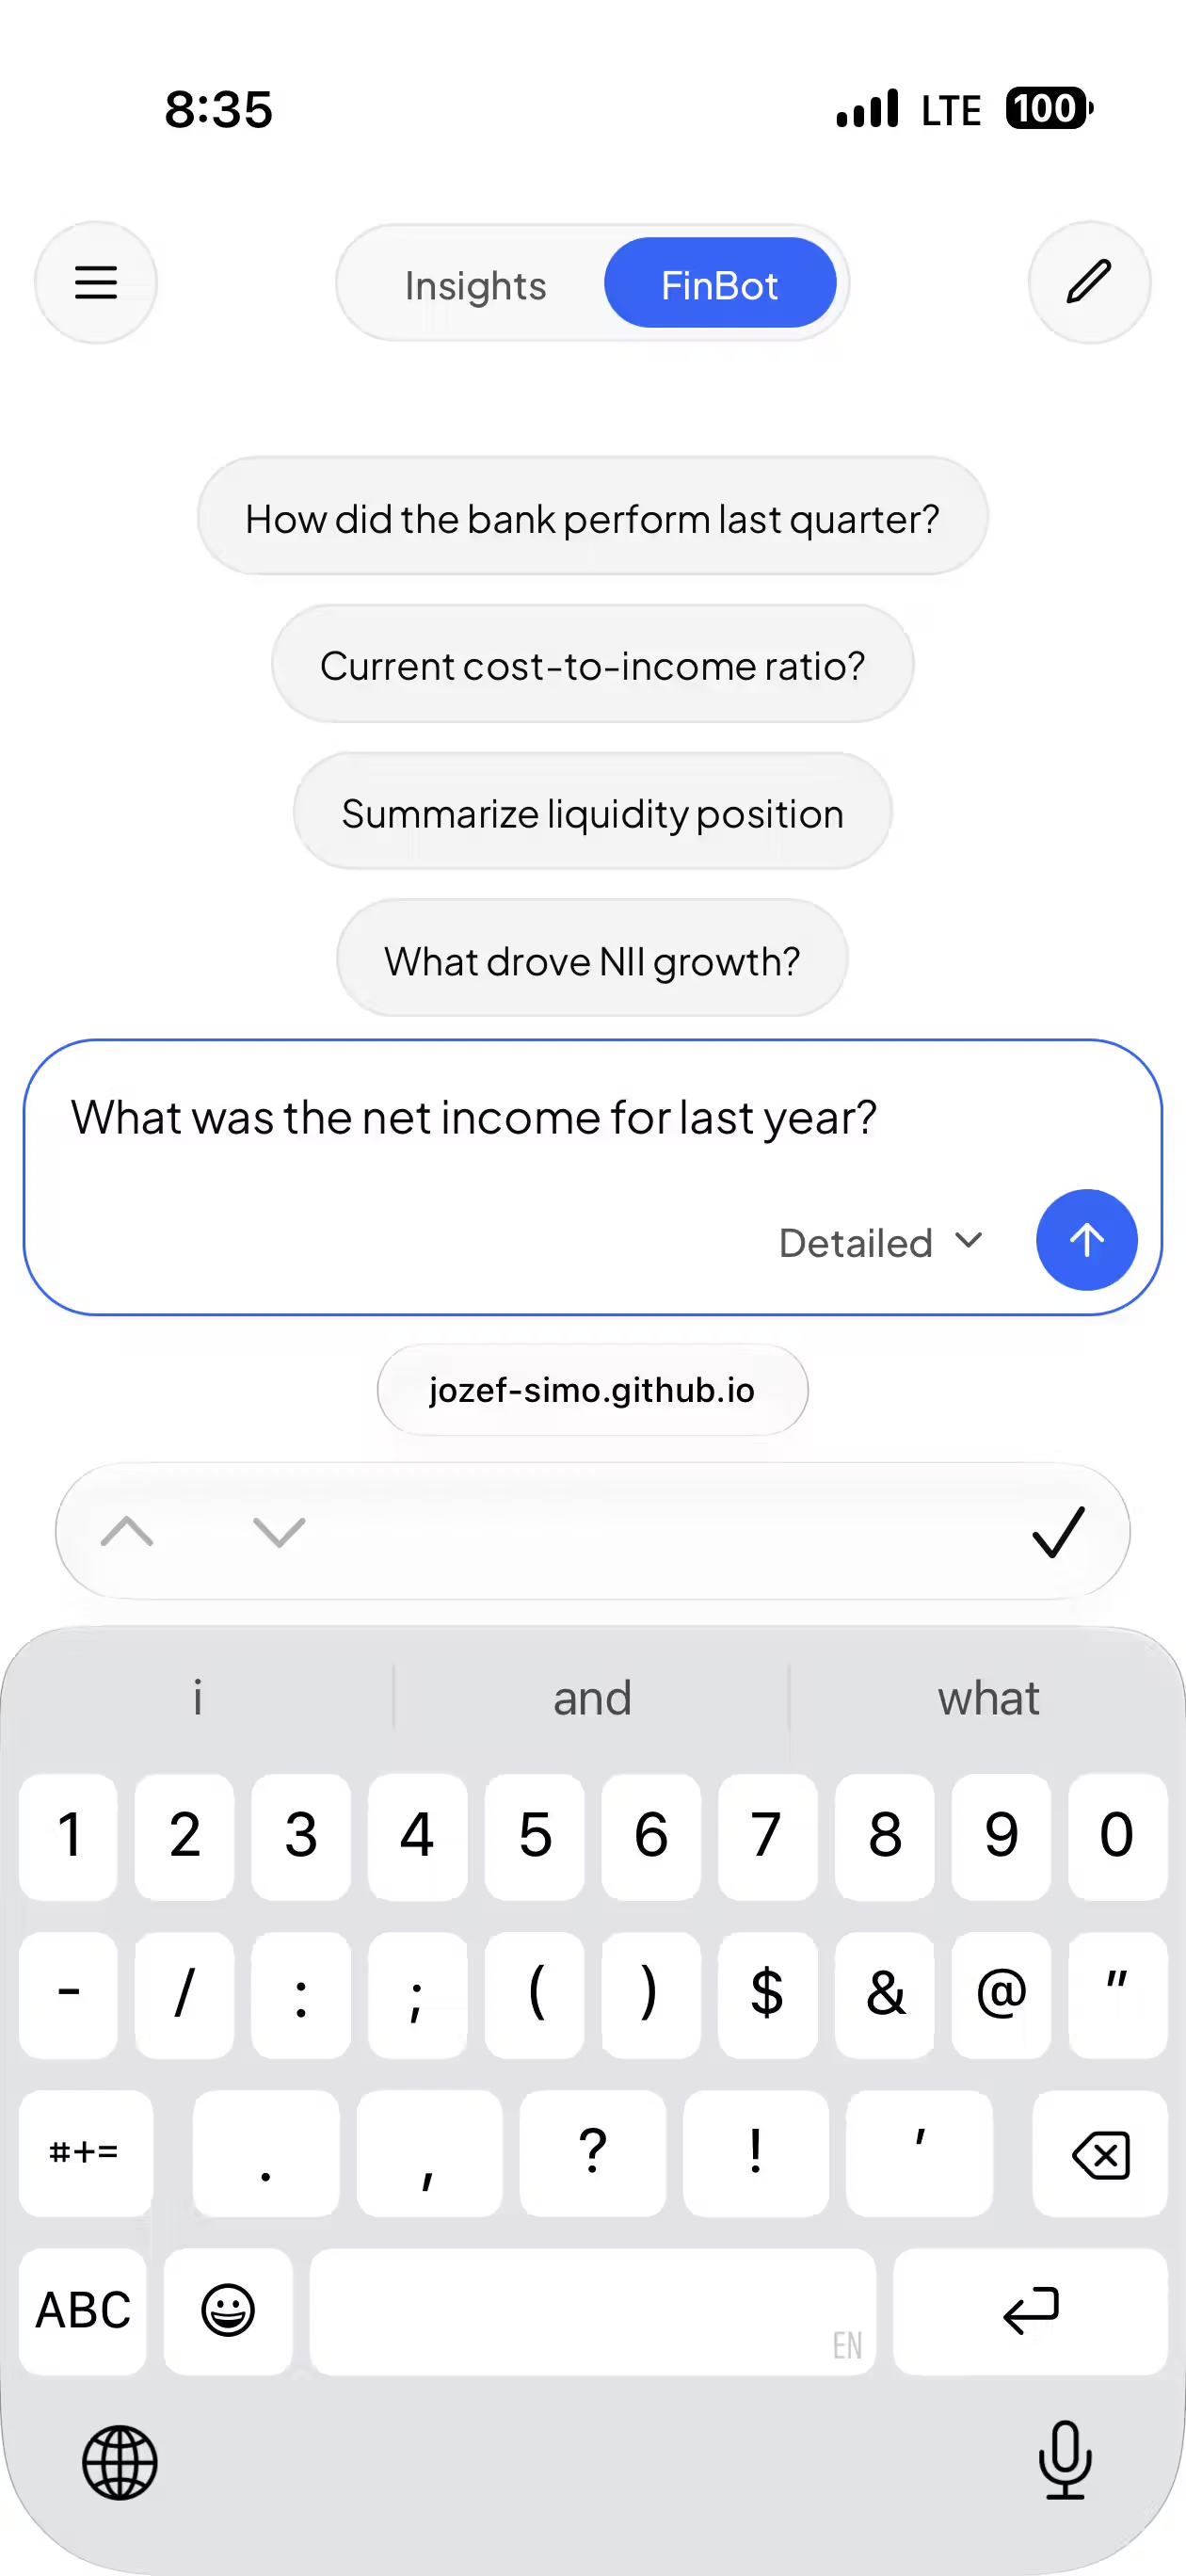
Before
- Broke on tablet/mobile; horizontal scrolling through illegible cells.
- Off-palette, fixed-size charts.
- Visibly off-brand across color, type, components.
Engineering handover
10-day cycle of specs, questions, rework
Original · mock data.
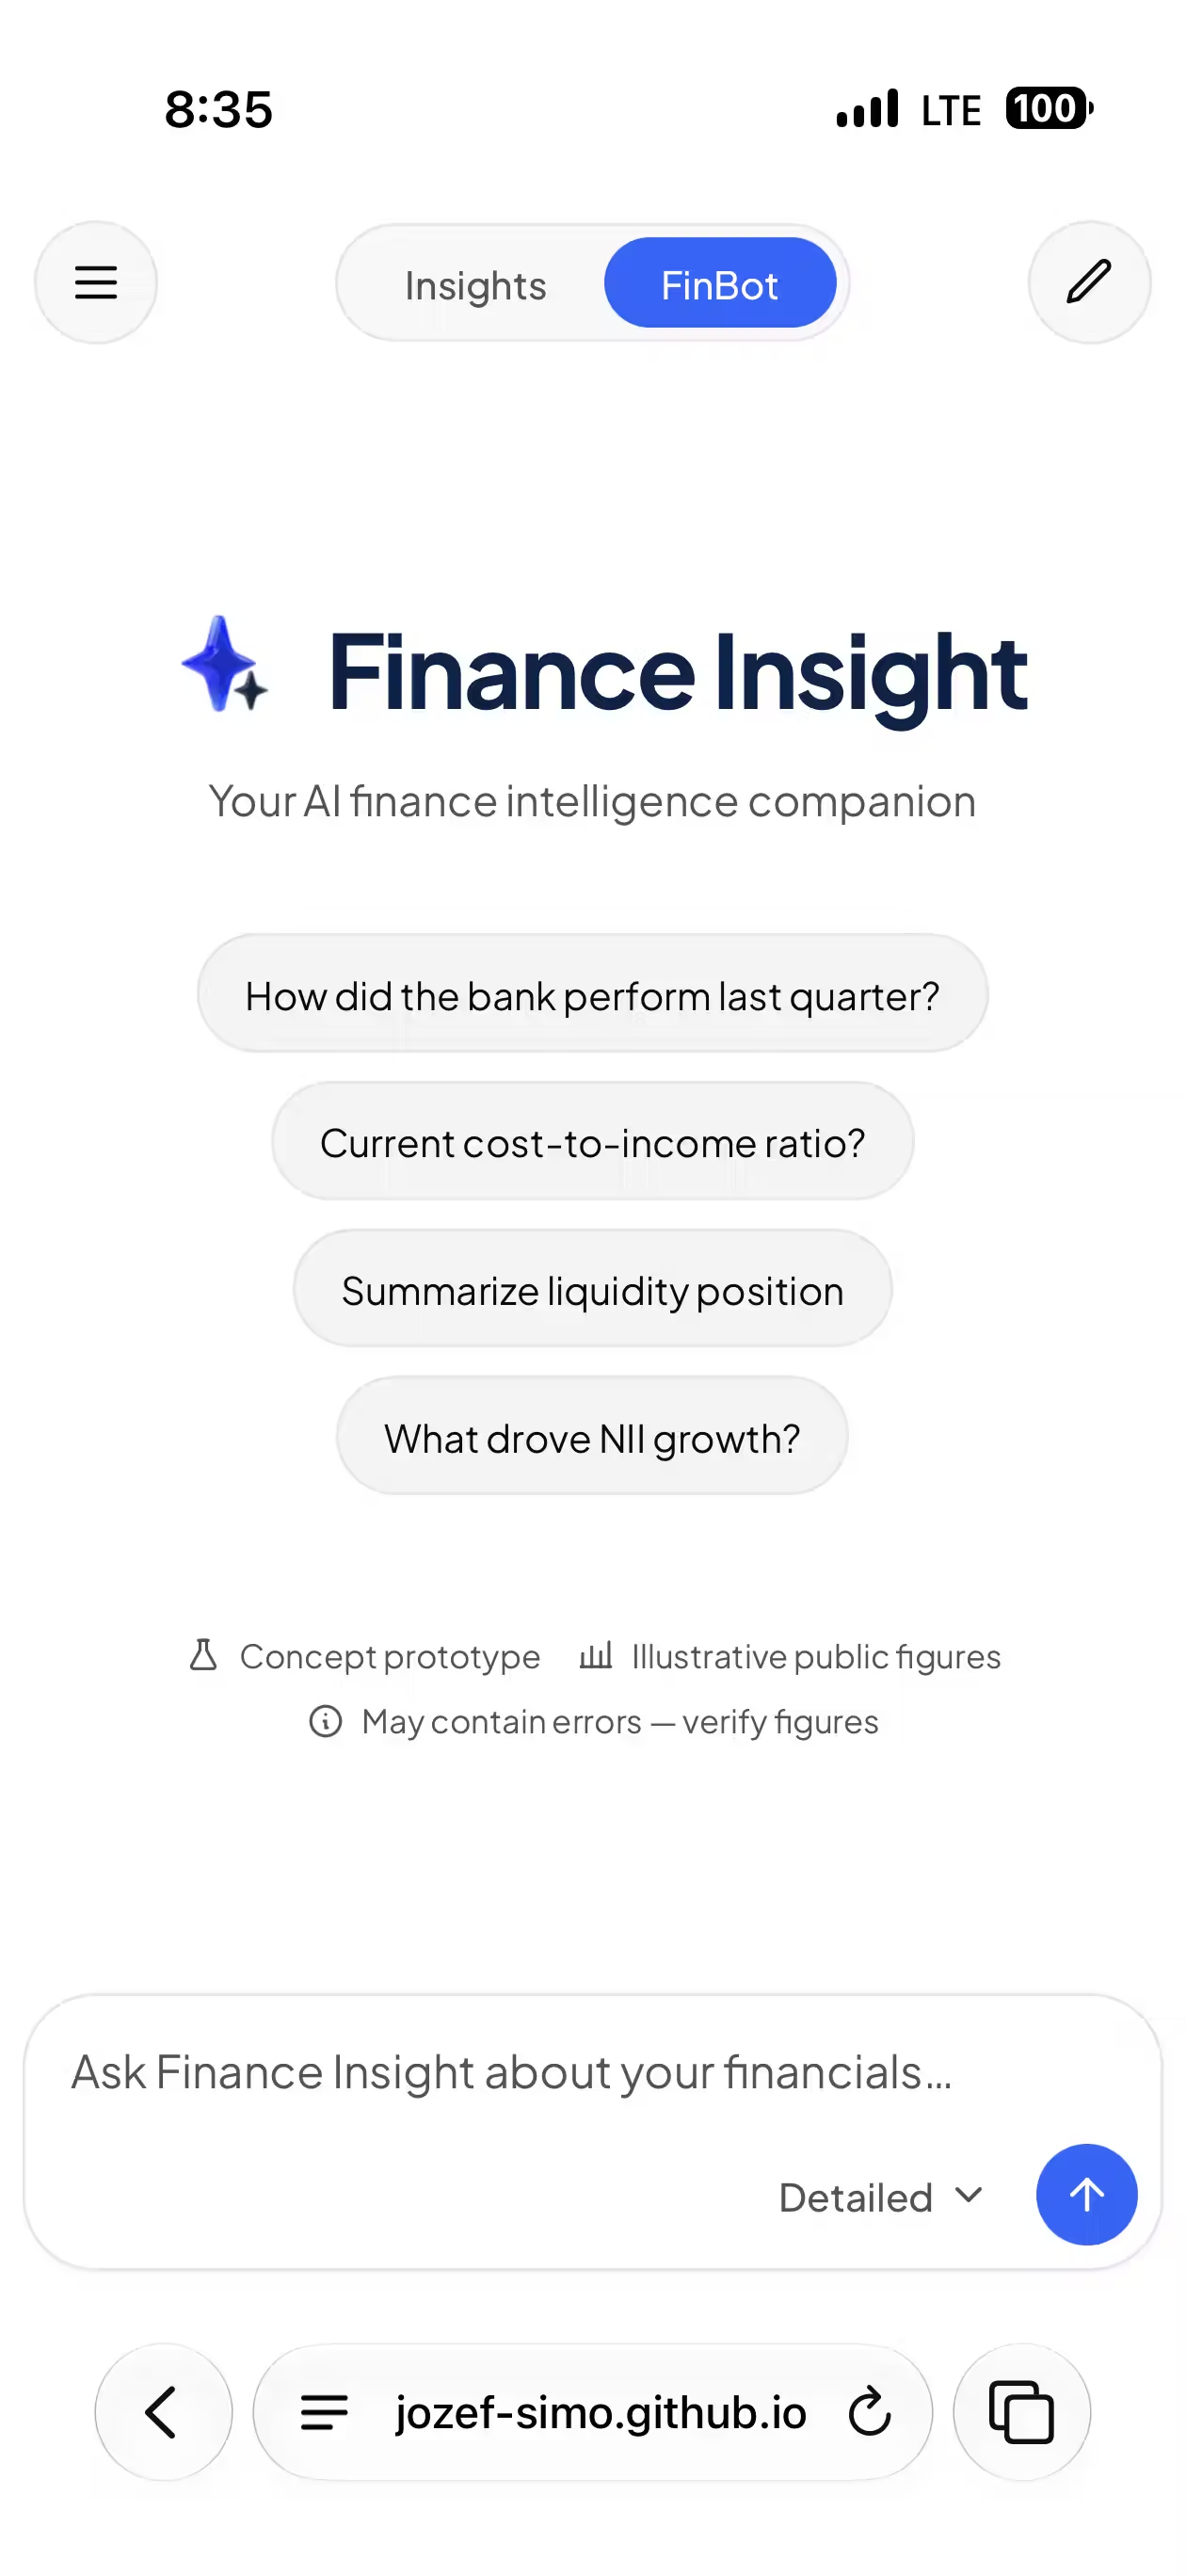
After
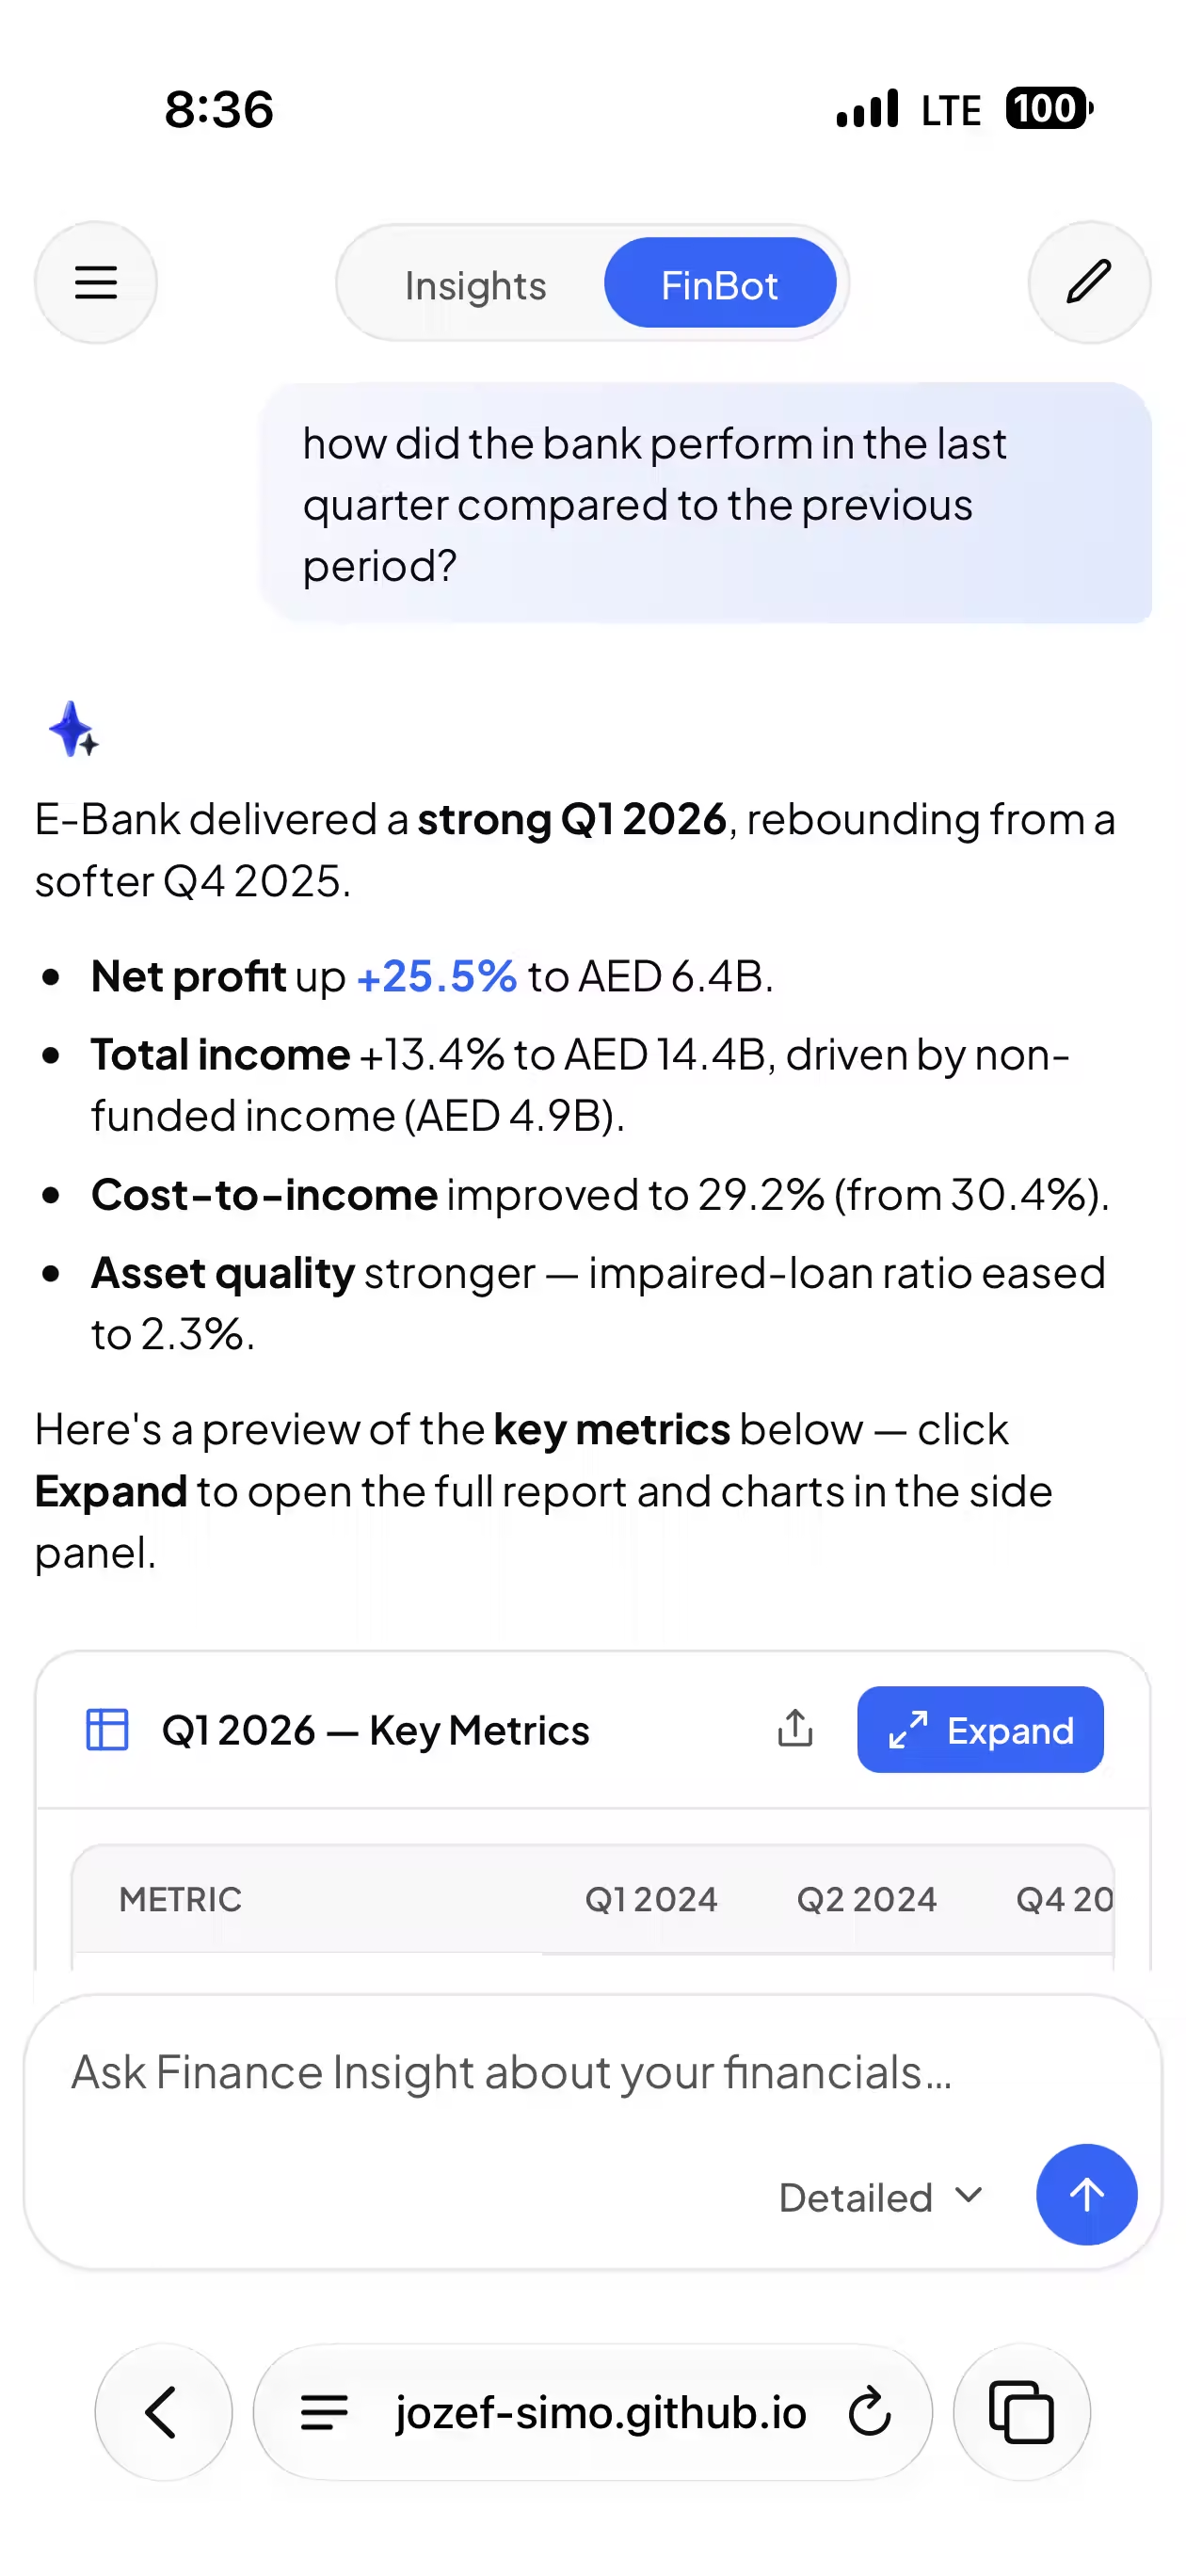
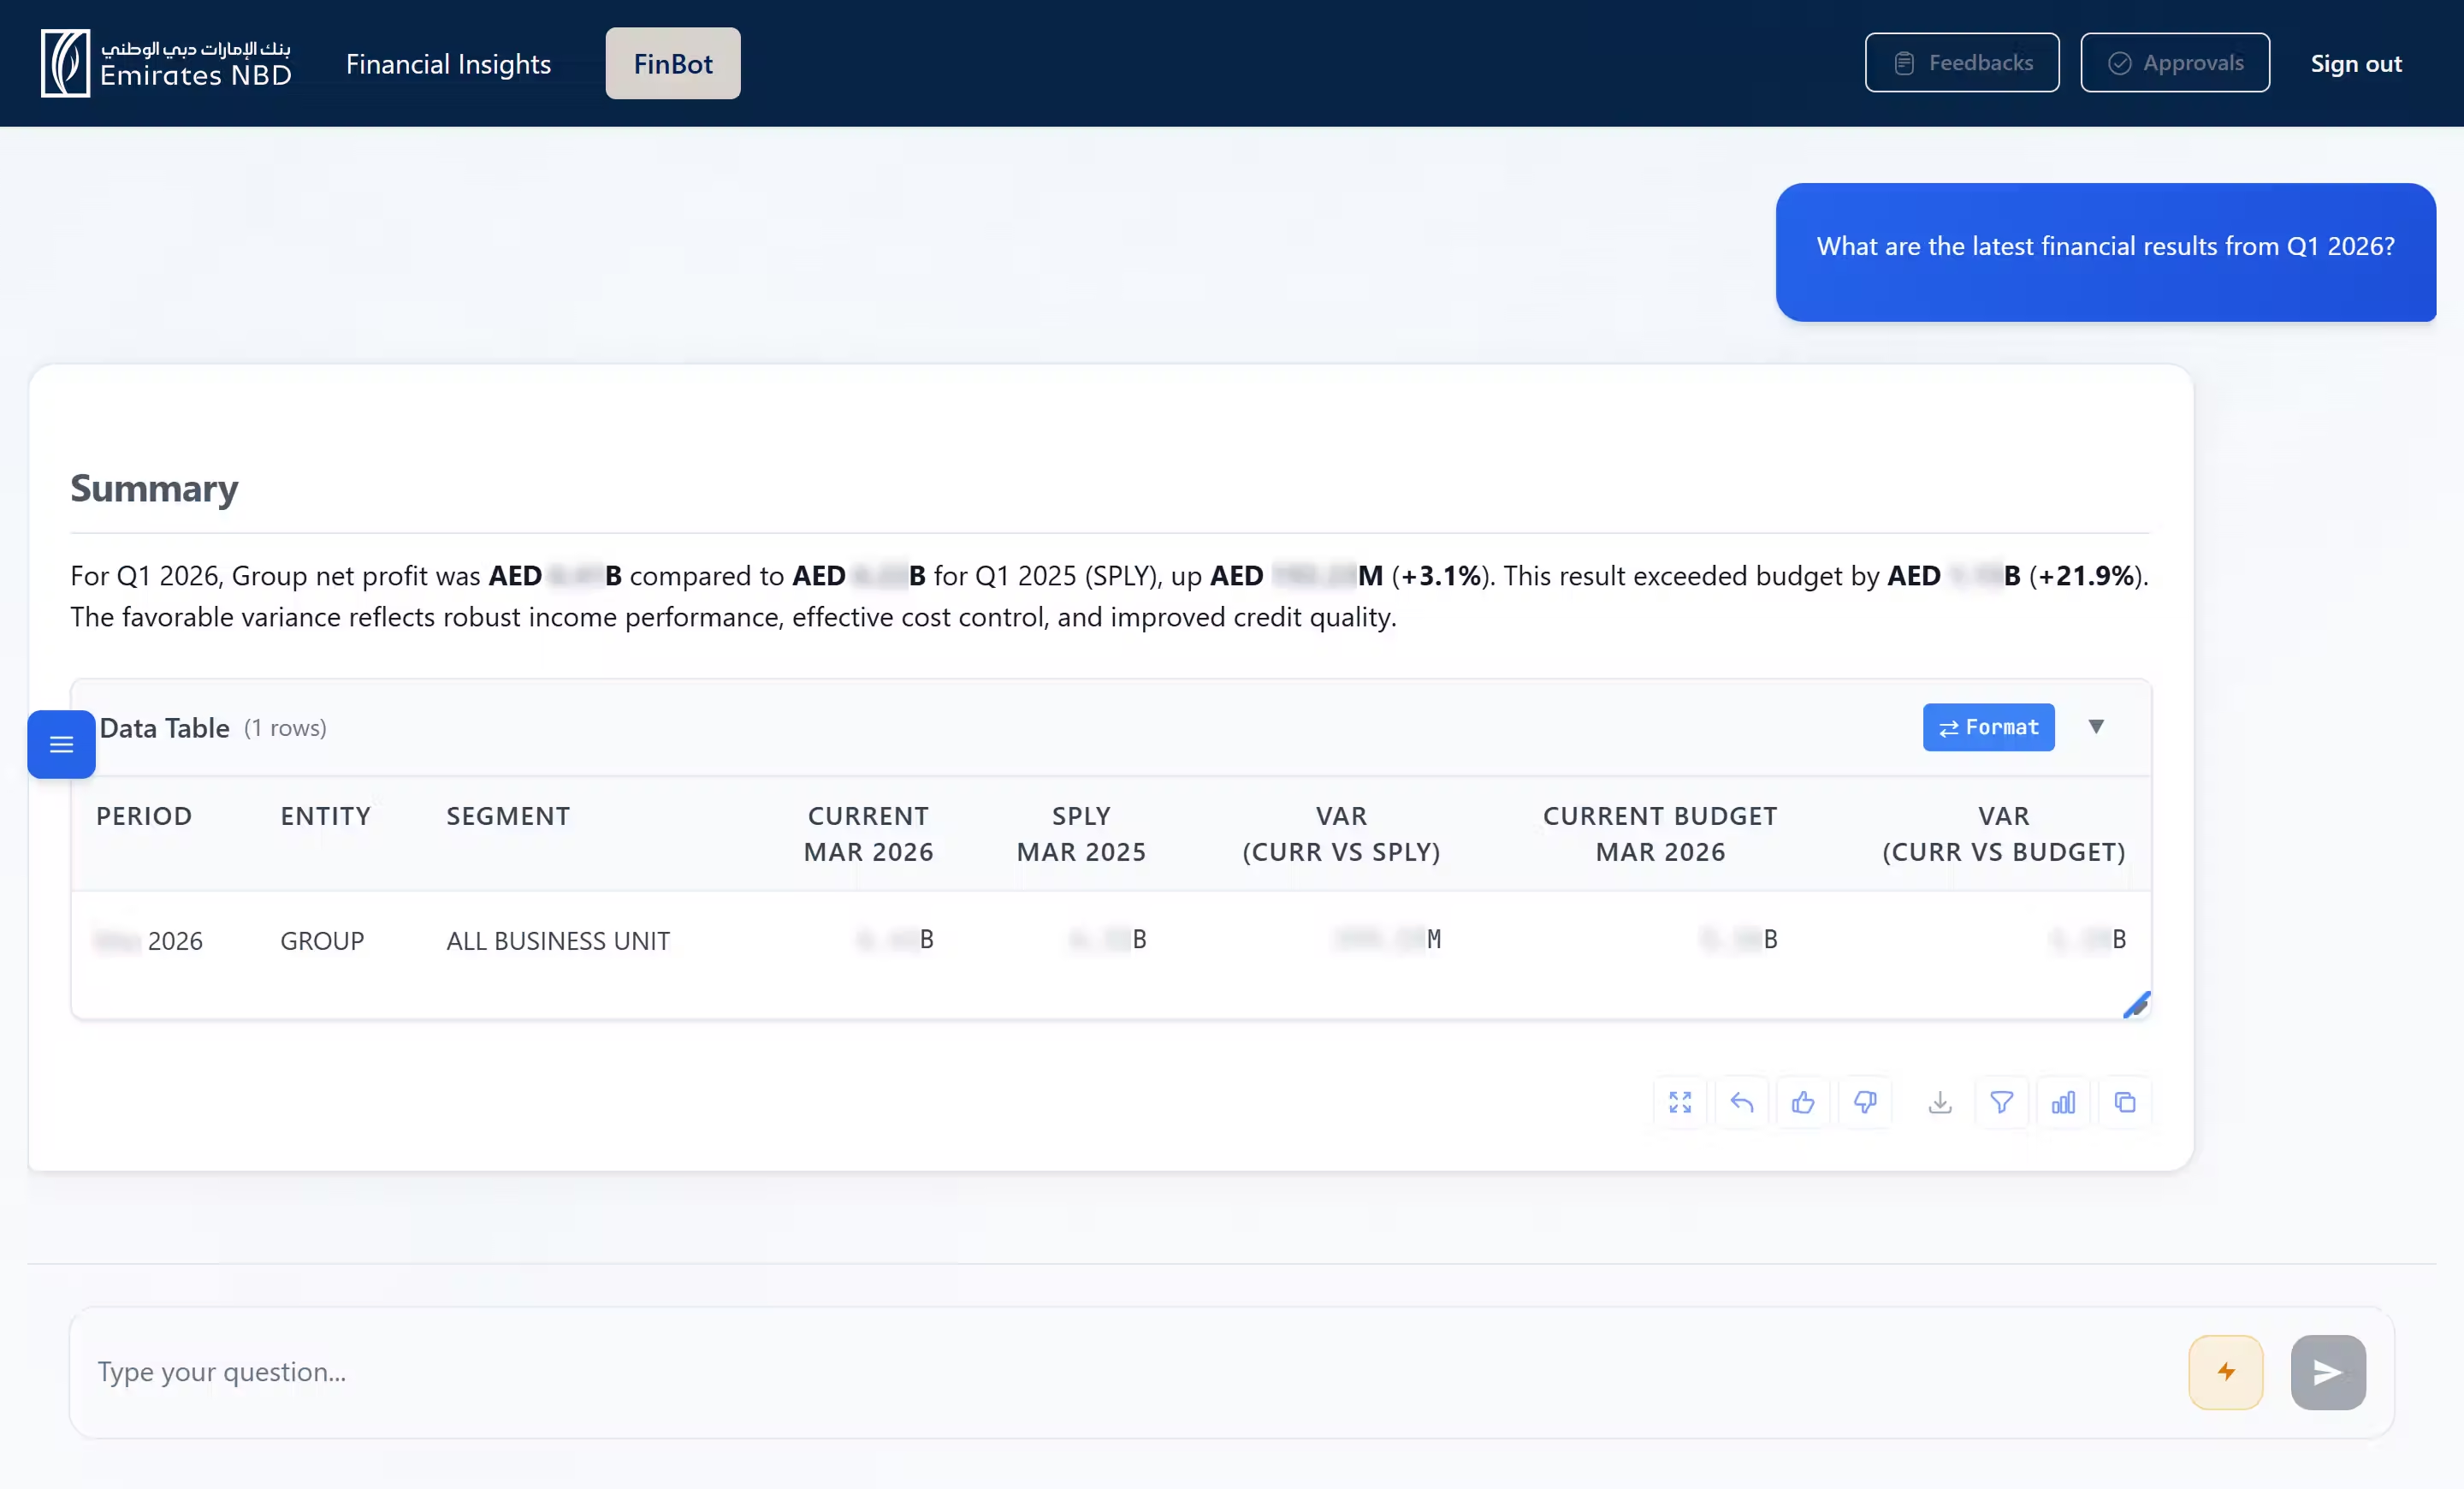
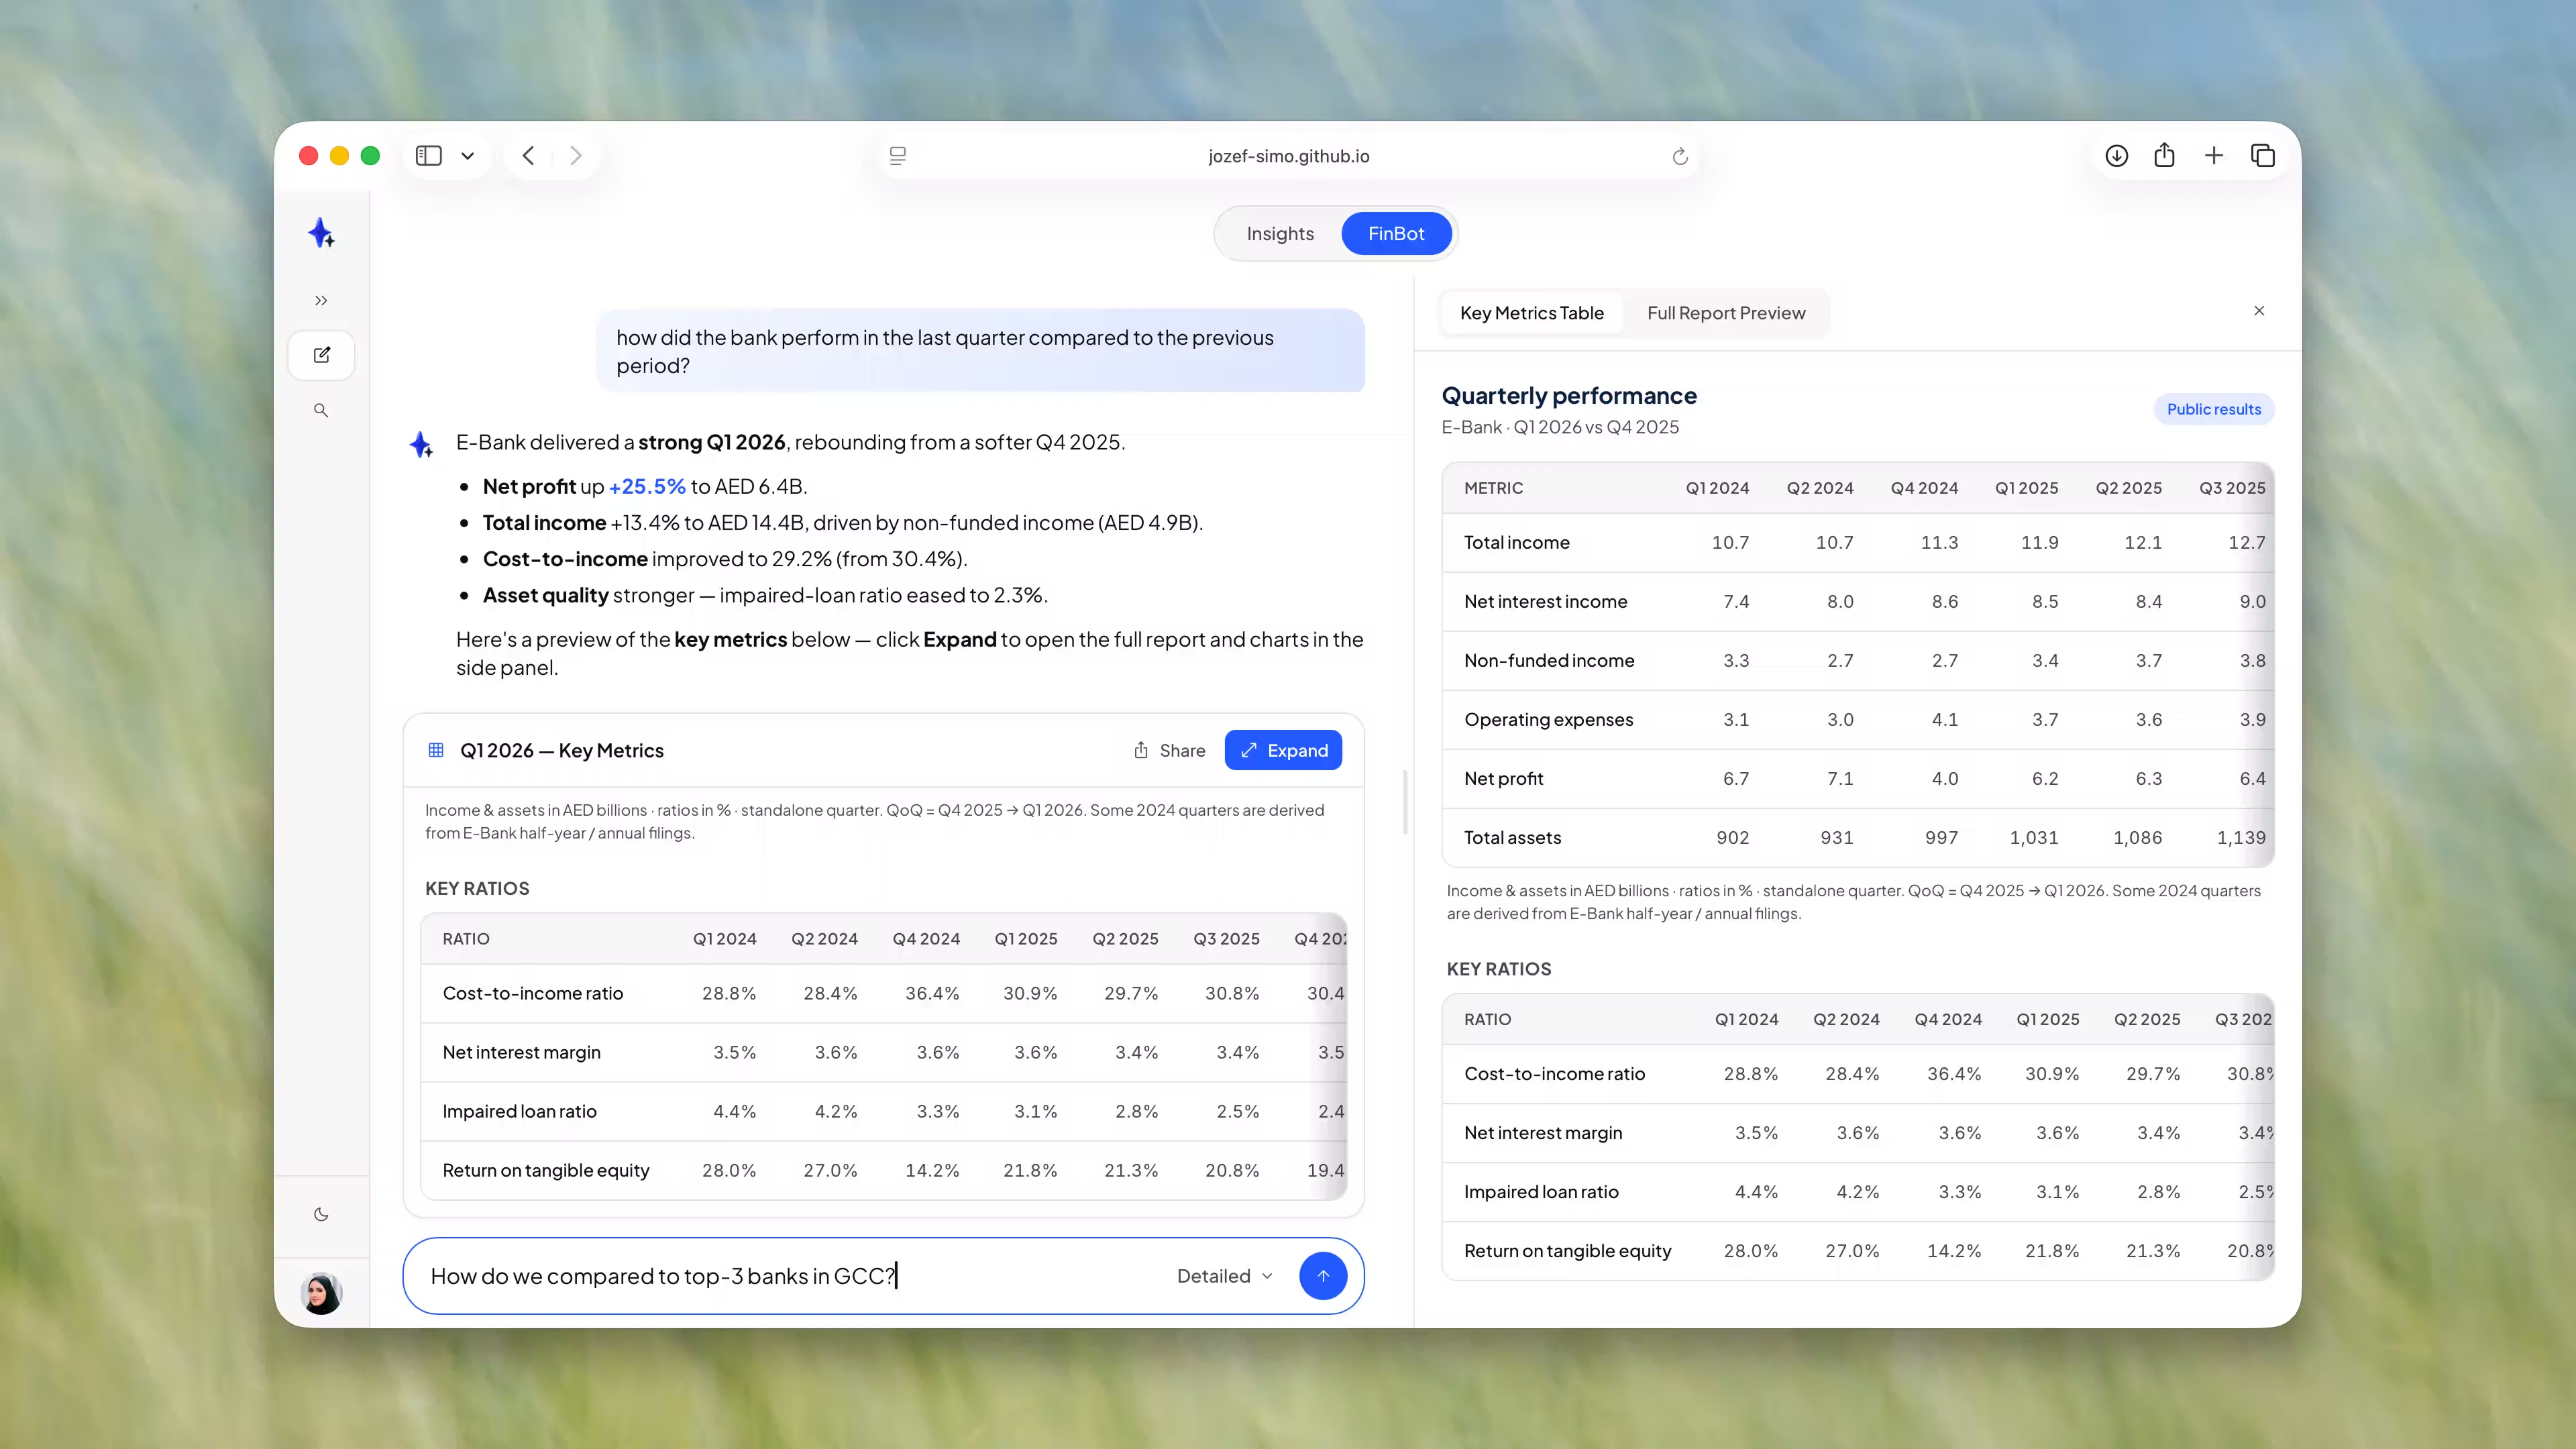
- Responsive tables: key columns prioritized, progressive disclosure for secondary data.
- Responsive charts: sizing rules per breakpoint with Recharts.
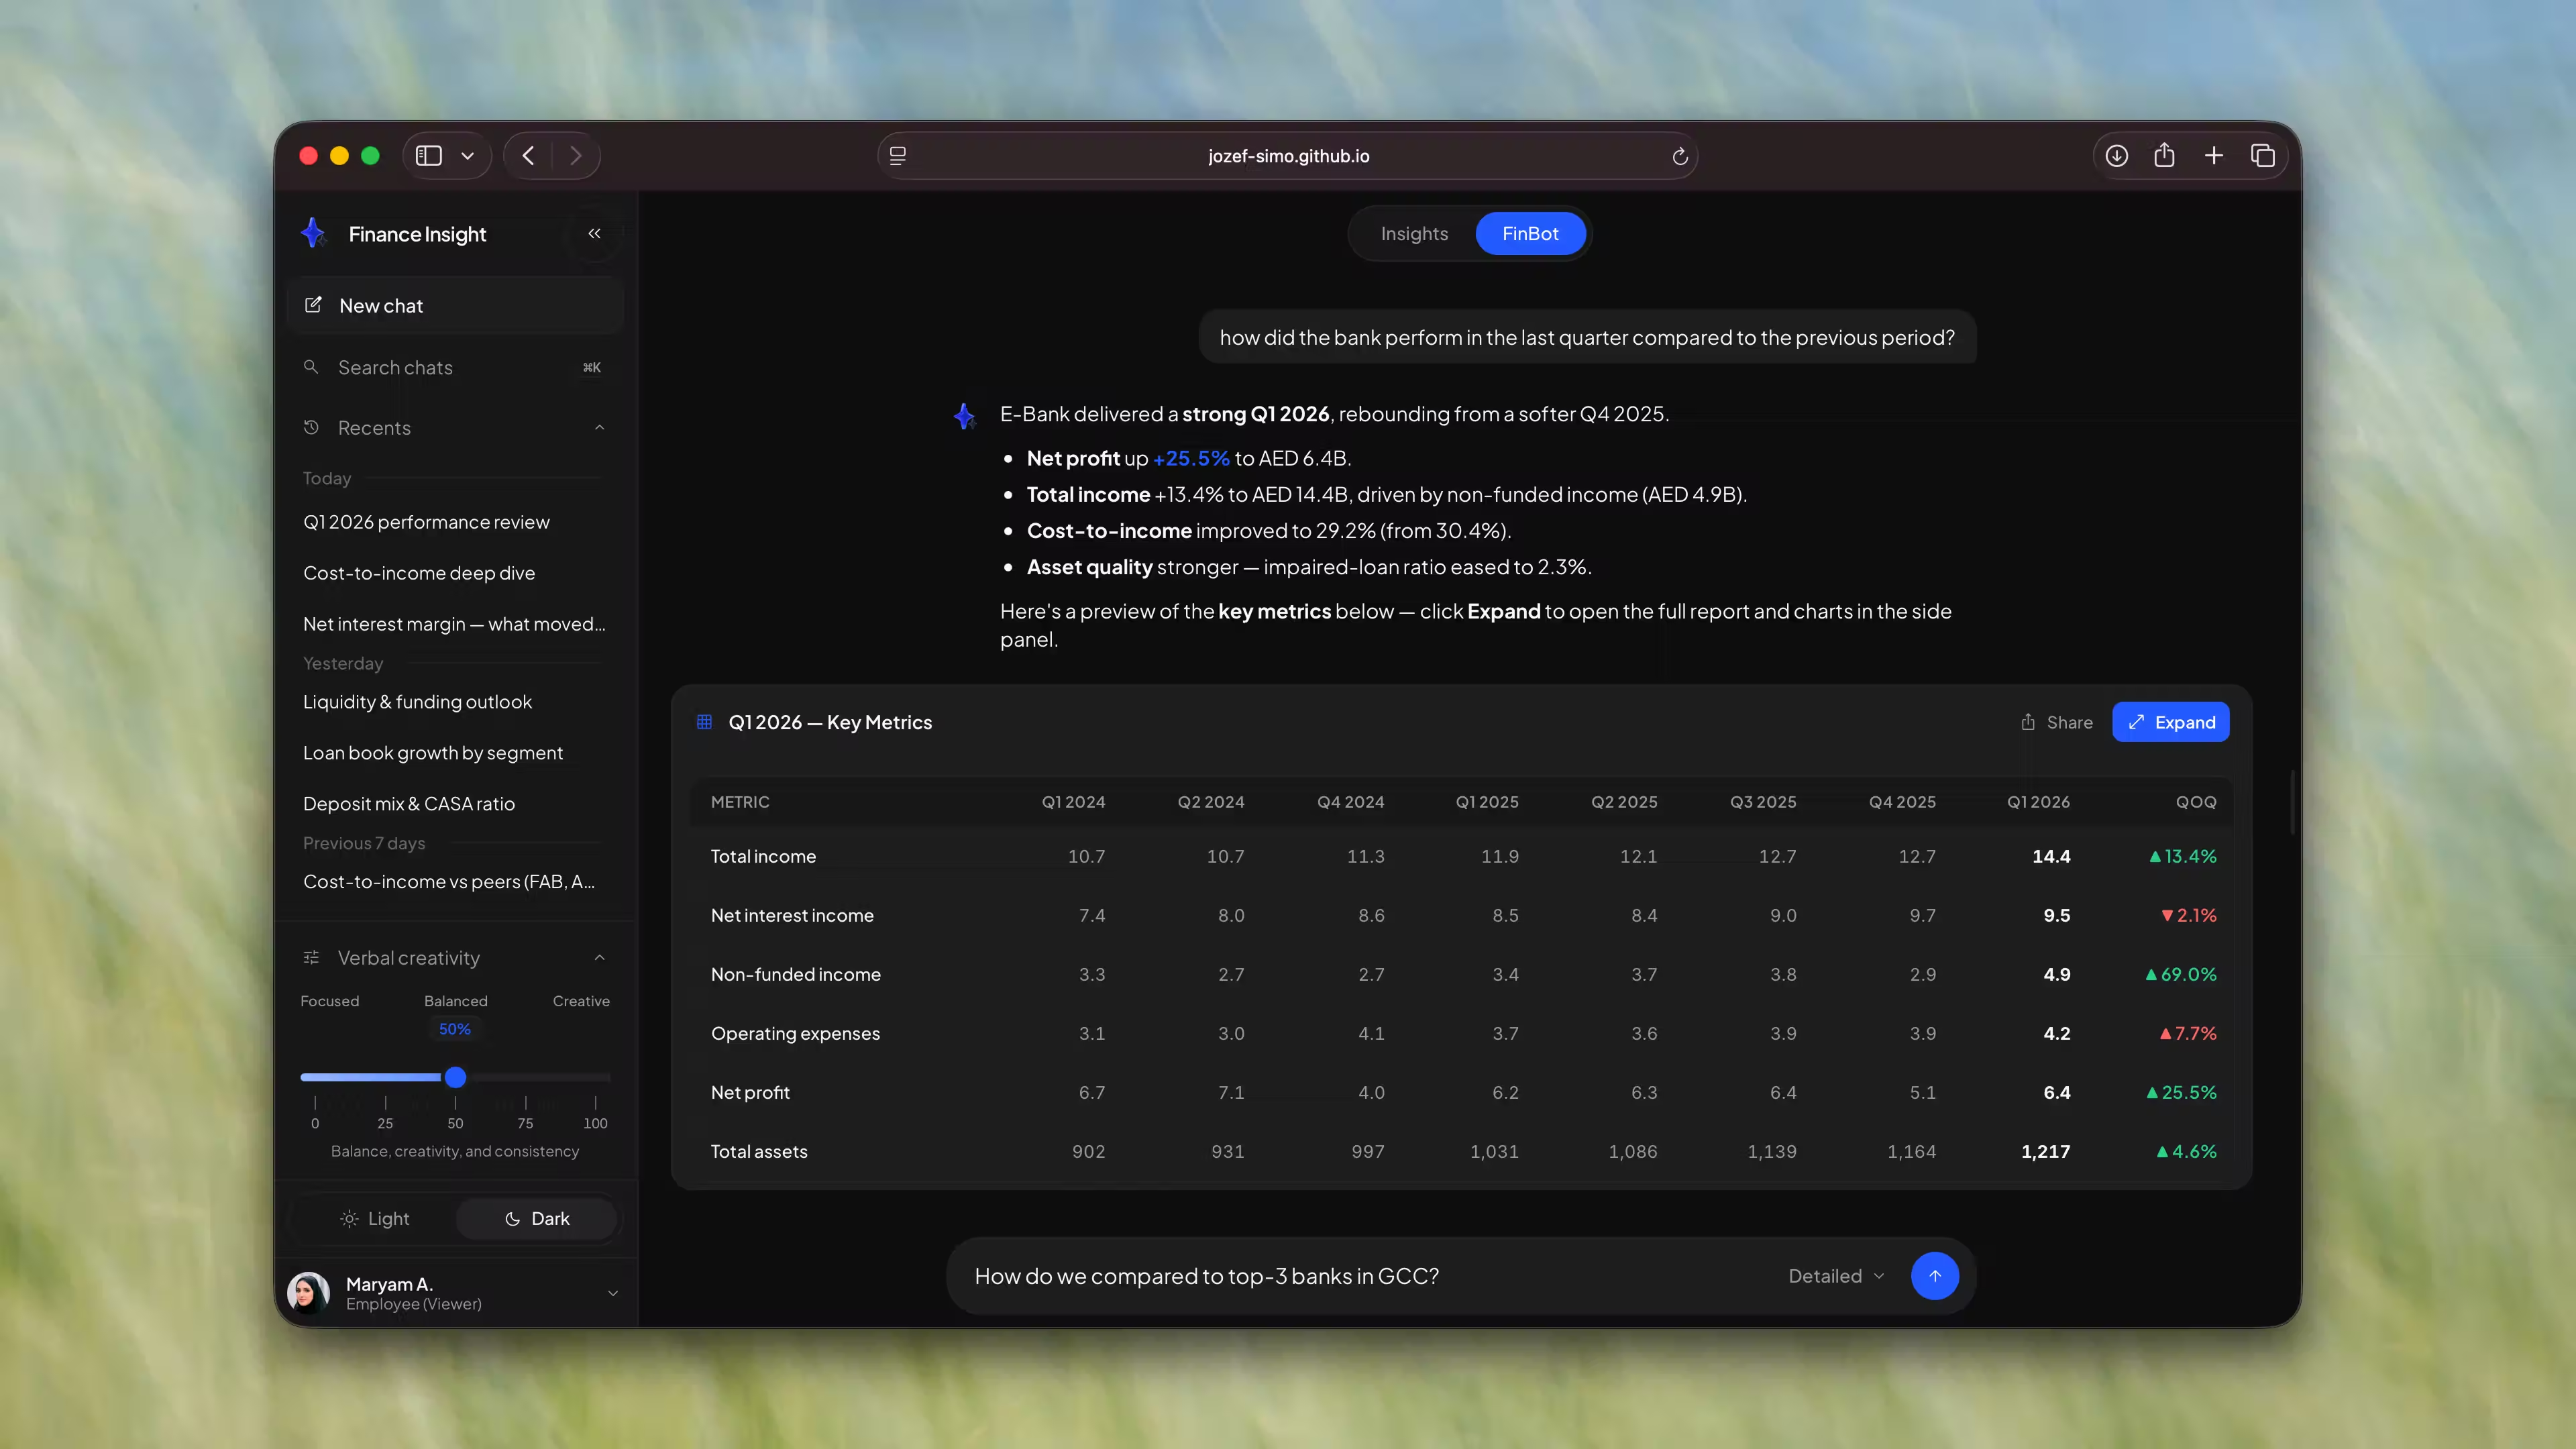
- Token-driven: every element mapped to ENBD design tokens.
Engineering handover
2 days - working codebase with embedded design-system documentation
Redesign · mock data.
Approach
We deleted the translation step: one prototype for review, documentation, and handover.
-
01
Working coded prototype from day one
-
02
Emirates NBD design tokens + Recharts for on-brand, readable data visualization
-
03
Deployed behind authentication login for stakeholder self-serve preview on their own devices
-
04
Live iteration sessions with business and technology together, against the running product
-
05
Dedicated design-system page embedded in the same artifact
-
06
Direct engineering handover from the reviewed codebase
Results
The handover number was the headline. The 80% reduction didn’t come from working faster - it came from deleting the translation step. The artifact stakeholders signed off was the artifact engineers built from.
The login was the counter-intuitive win. Deploying the prototype behind authentication seemed like extra effort for a preview. In practice it dissolved the review-meeting model: stakeholders opened the live product on the very tablets and phones where the original tool was broken, watched the tables reflow themselves, and feedback arrived continuously instead of in scheduled rounds.
(opens in a new tab)
What shipped, and what survived
The redesigned Finance Insight is in weekly use across the Finance department: +40 users, +600 queries per month.
The delivery model outlived the project. The coded-prototype workflow, one artifact for sign-off, documentation, and handover, replaced static mockups as the standard operating model for my eight-person team across all eight Bank Functions domains. Every subsequent initiative inherits the compressed cycle by default.
Senior business stakeholder quote on the collaboration and outcome.
If your team is still signing off pictures of the product, let’s fix that.
Let’s talk